Simpler Analytics: A clearer view of what people read
A focused reporting workspace for website traffic, resource rankings and PDF engagement.
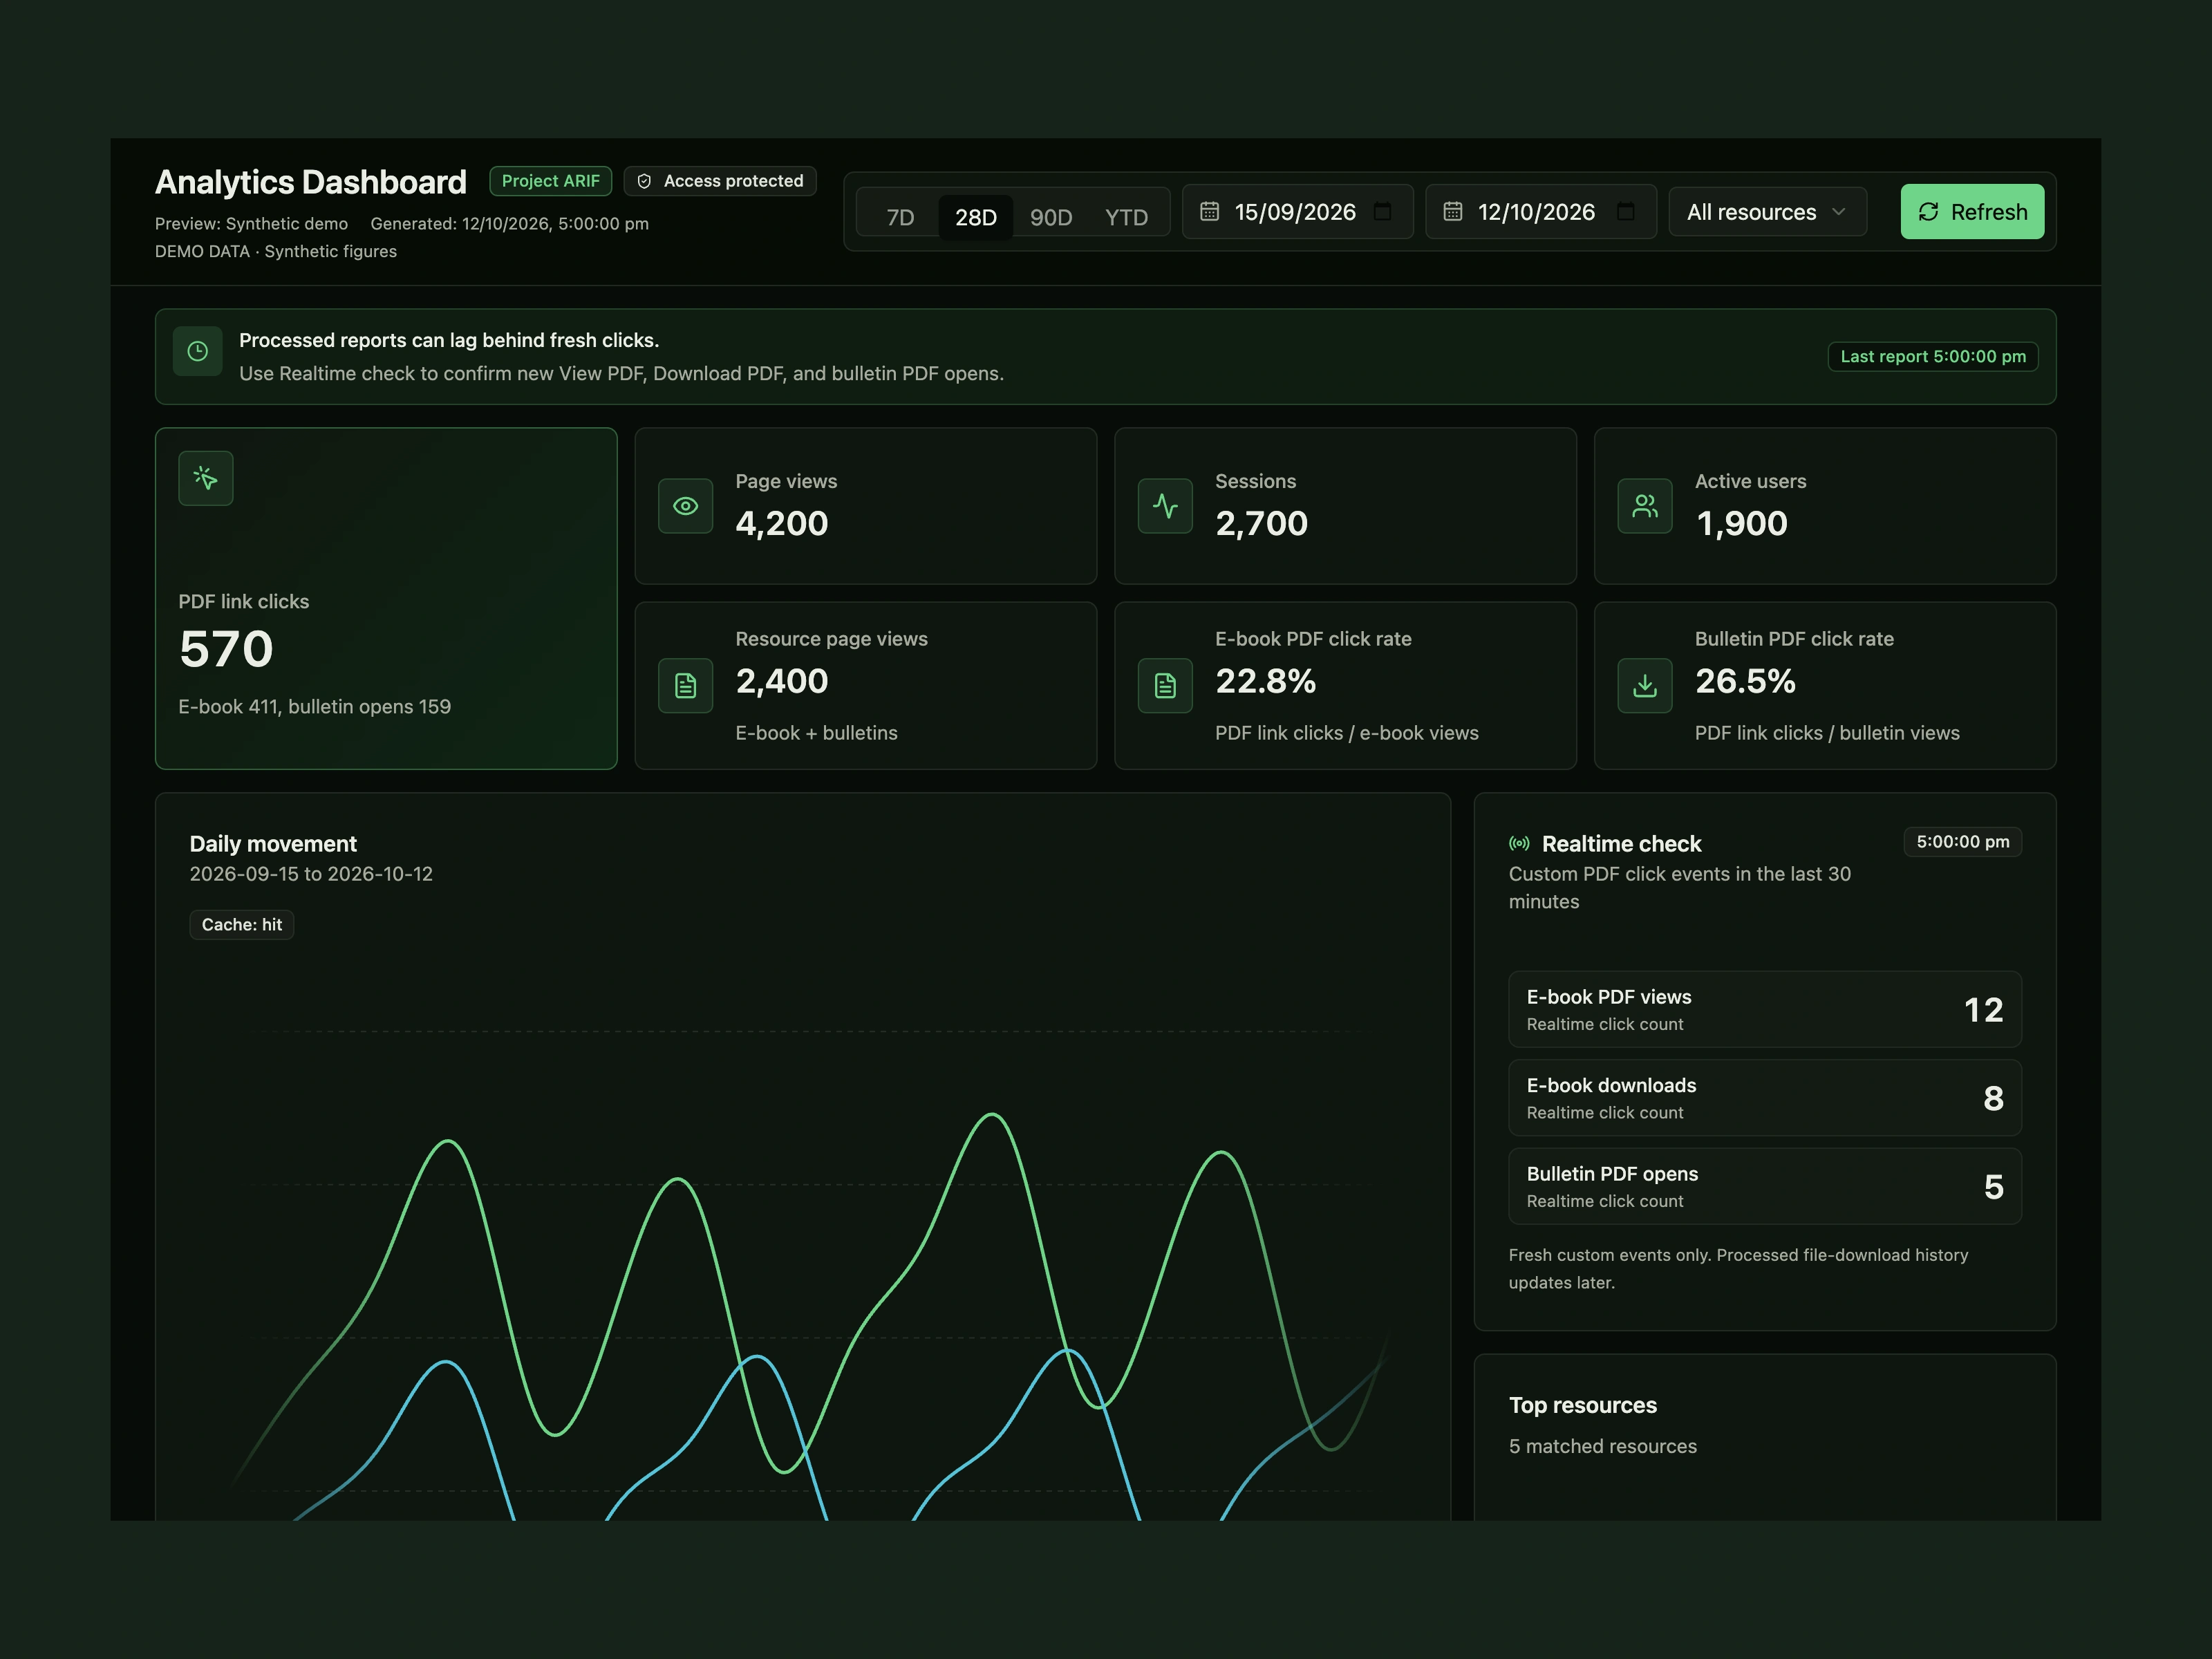
The overview, with context.
Traffic and resource engagement sit together, with a notice explaining processing delays.
Why I did this
The reporting question is specific: which resources do people use? I brought traffic, resource rankings and PDF actions together so those signals can be inspected in one place.
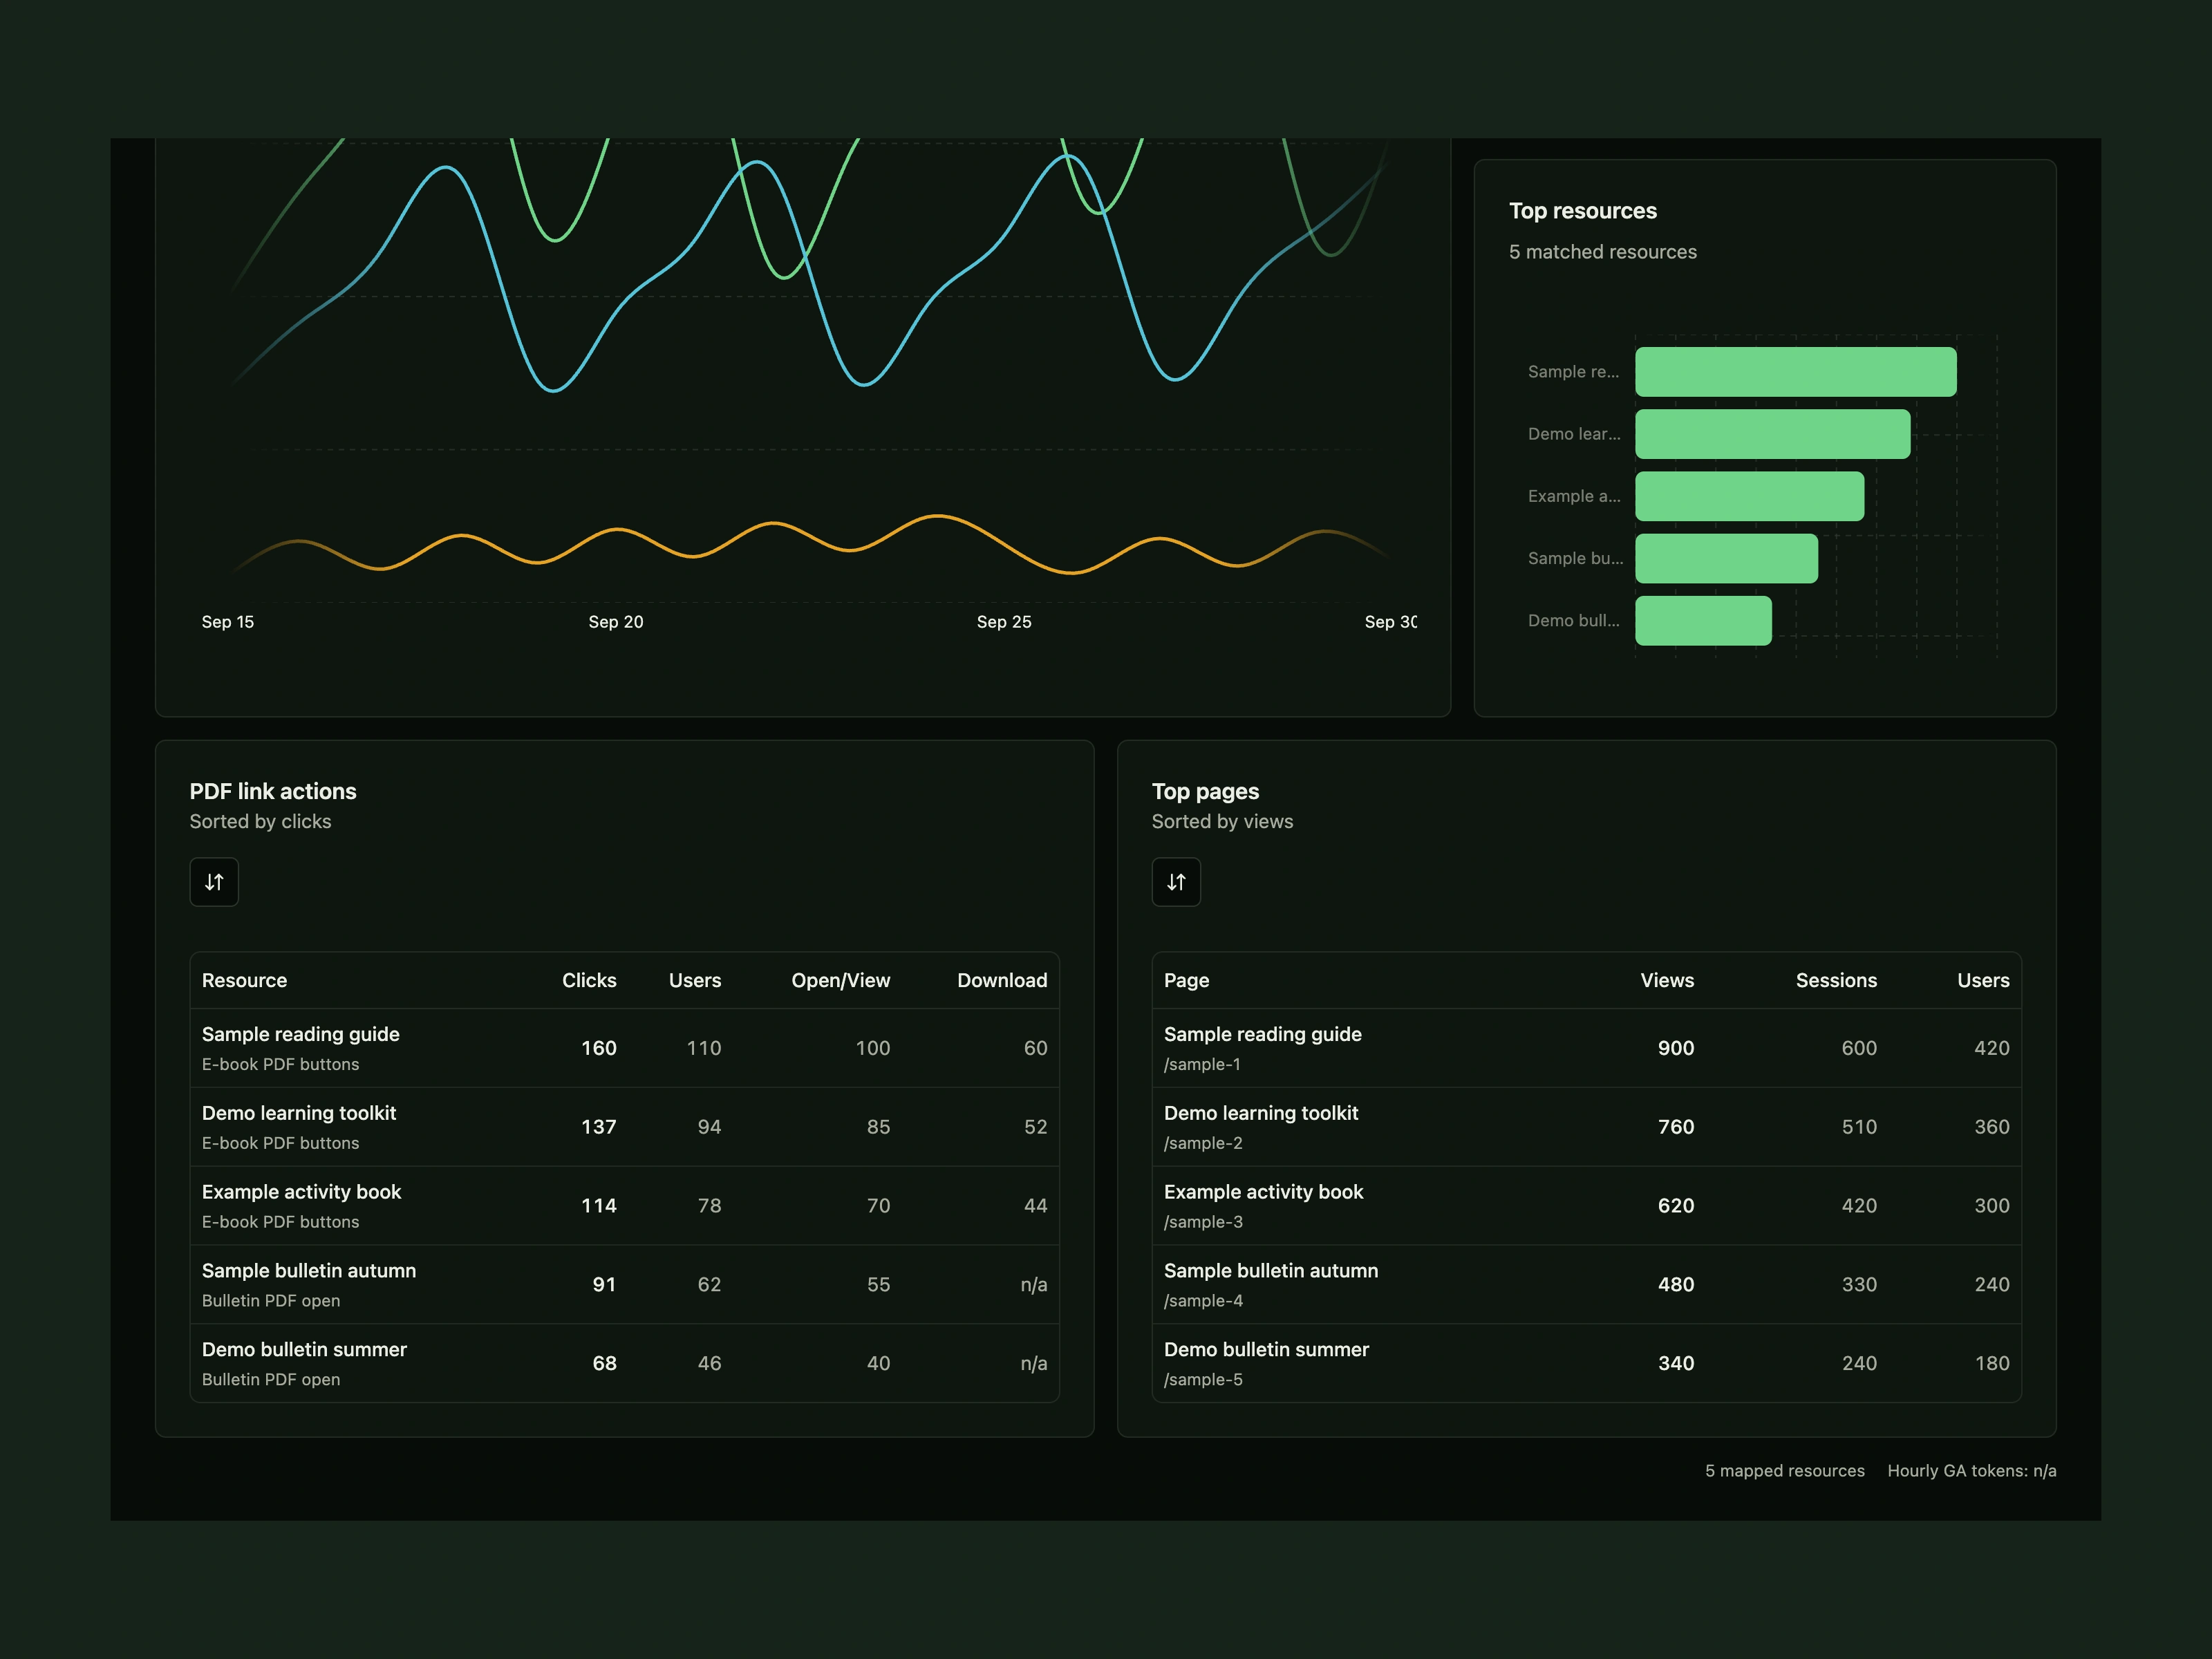
From the trend to the detail.
Resource and page tables expose the counts behind the overview.
How I did it
I connected the GA4 Data API to React through a Cloudflare Worker, with cached reports and a WordPress helper for resource metadata and PDF events. Date controls, filters and sortable tables support closer inspection.
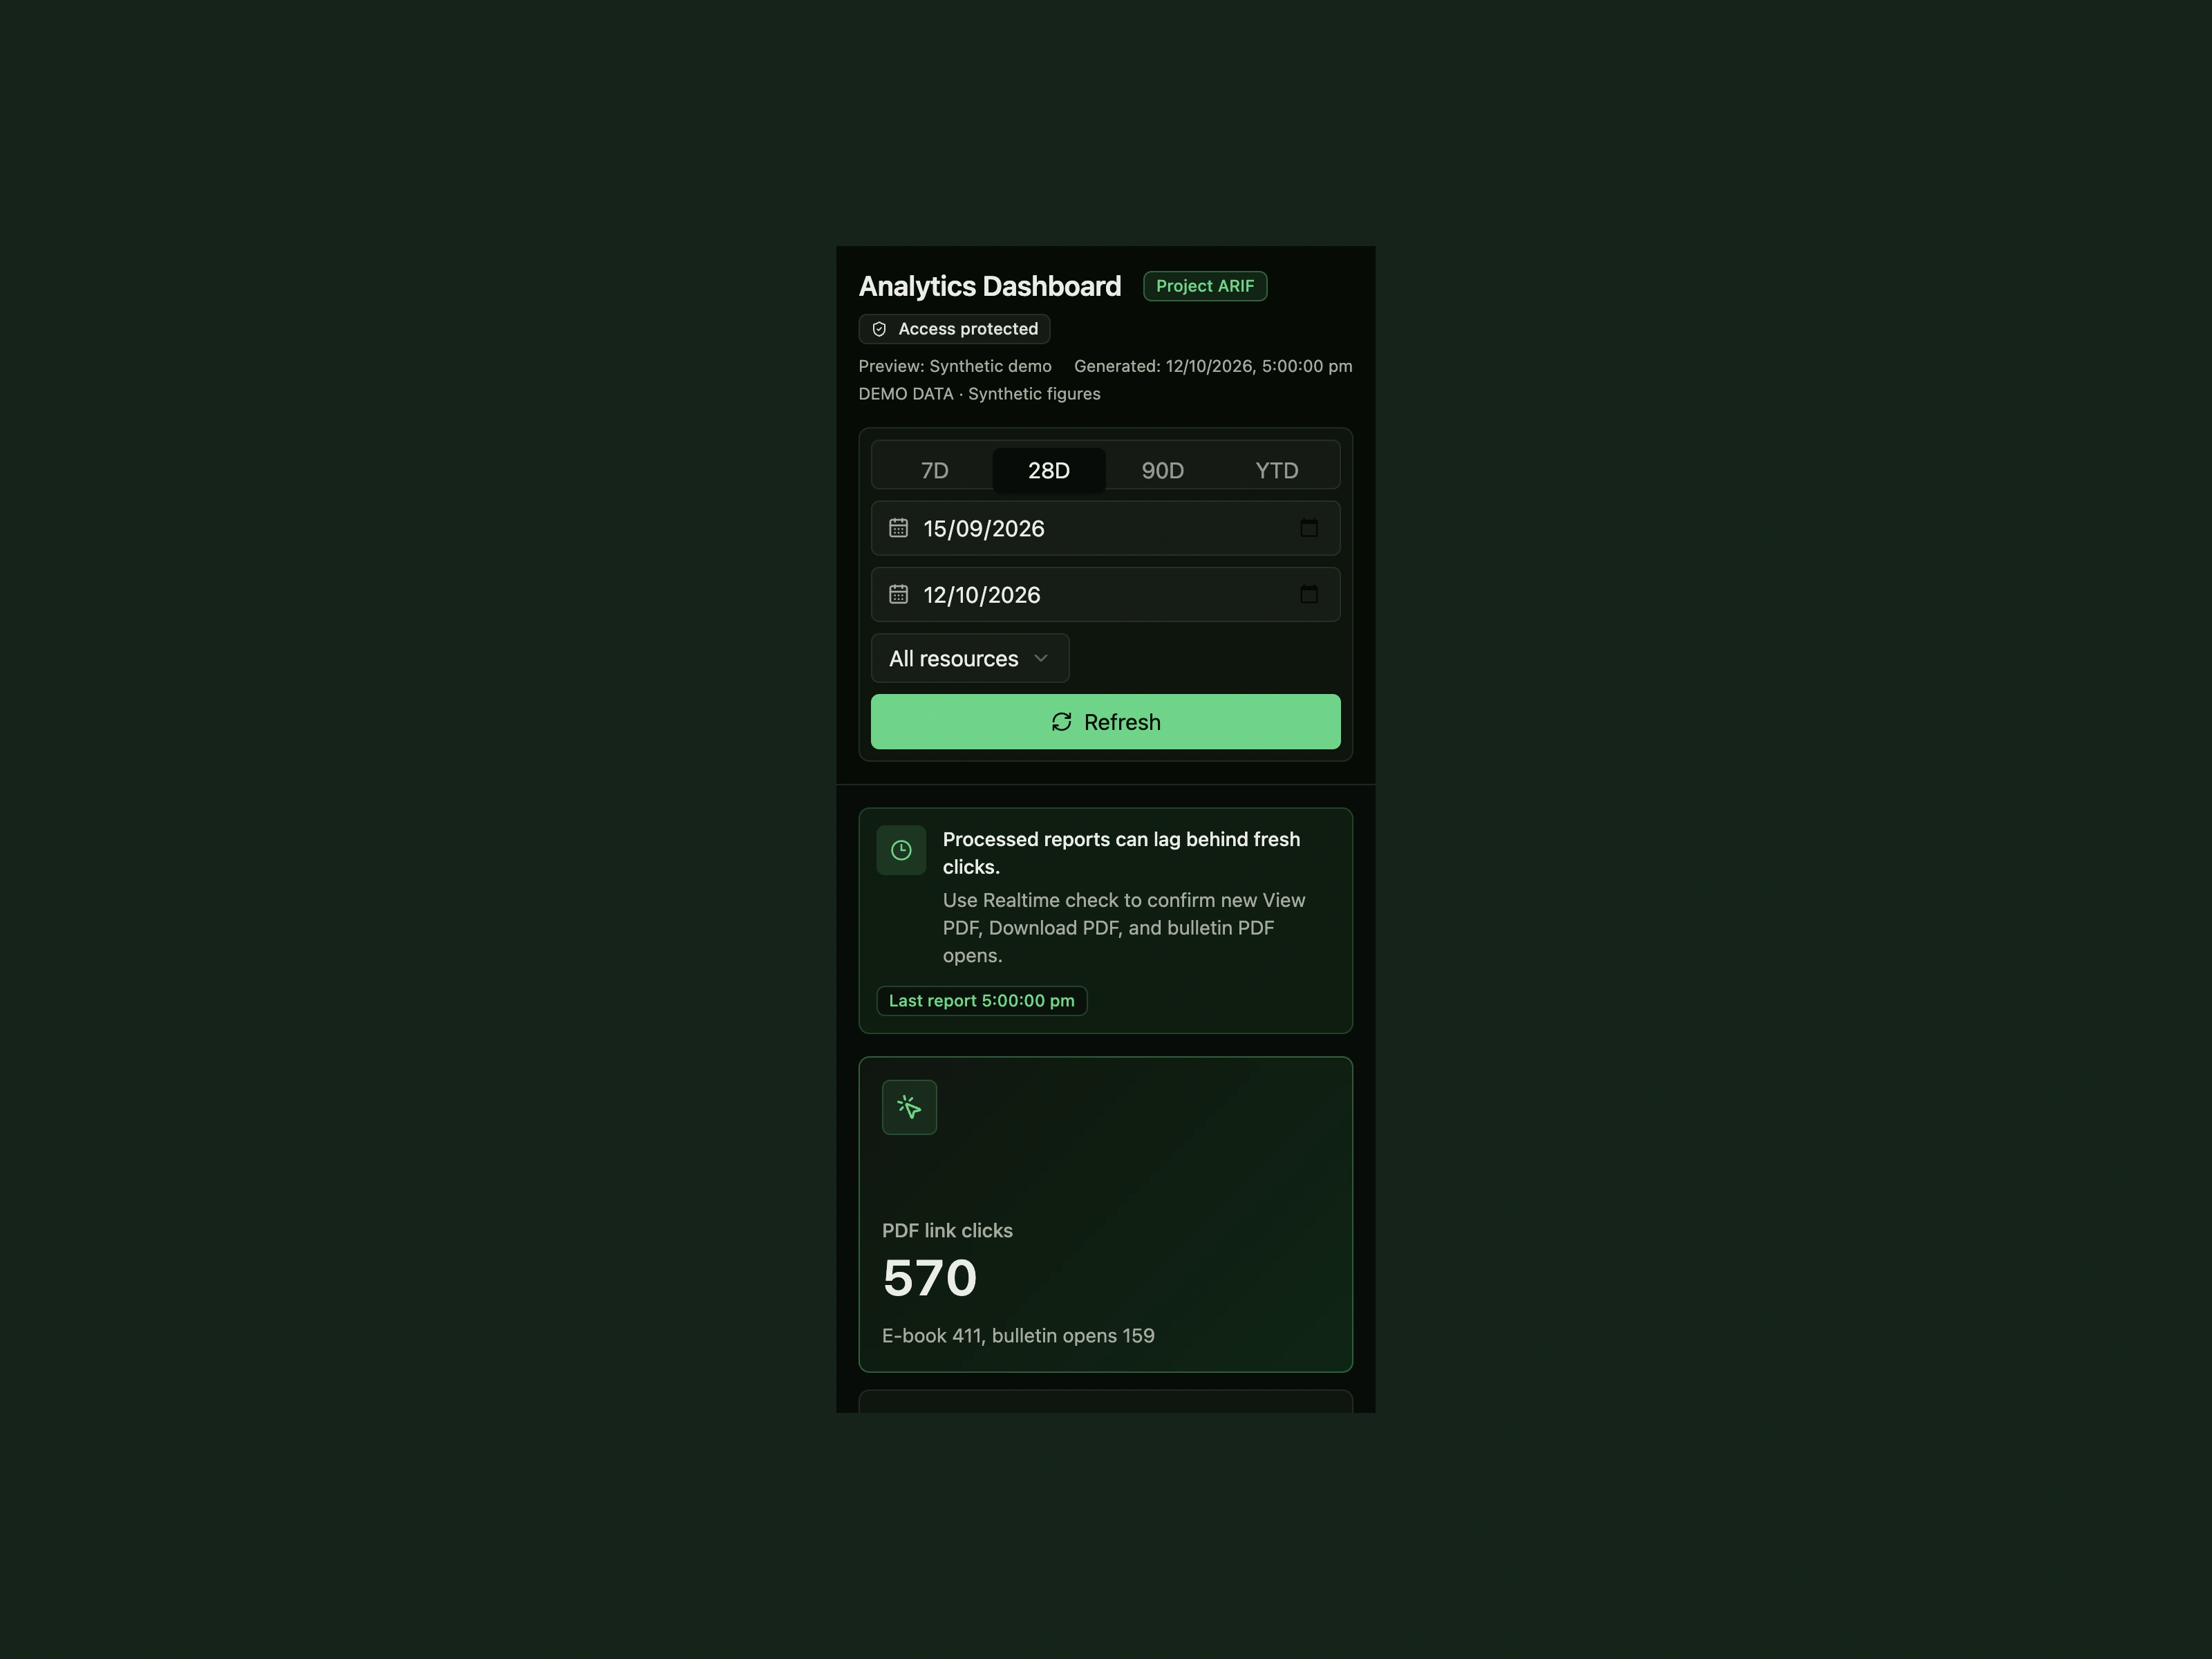
Useful controls on a smaller screen.
Date ranges and metric cards stack for mobile inspection.
Outcomes
The interface separates processed reports from recent PDF events and makes resource comparisons easier to navigate. The visuals use synthetic metrics and resource names; they do not represent client performance.